THEME: TRUST IN HEALTHCARE
Trust in the physician–patient relationship in developing healthcare settings: a quantitative exploration
Vijayaprasad Gopichandran, Satish Kumar Chetlapalli
DOI: https://doi.org/10.20529/IJME.2015.043
Abstract
Trust in physicians is the patient’s optimistic acceptance of vulnerability and the expectation that the physician will do what is best for his/her welfare. This study was undertaken to develop a conceptual understanding of the dimensions and determinants of trust in physicians in healthcare settings in resource-poor, developing countries. A cross-sectional household survey was conducted on a sample of 625 men and women from urban and rural areas in Tamil Nadu, India. The sample was selected using a multistage sampling method and a pre-tested structured questionnaire was utilised. The questionnaire covered the five dimensions of trust: perceived competence of the physician, assurance of treatment, confidence in the physician, loyalty towards him/her, and respect for him/her. Items covering four main factors that influence trust, ie shared identity, the physician’s behaviour, personal involvement of the physician and level of comfort with him/her, were included in the questionnaire. A structural equation model was constructed with the dimensions of trust on one hand and the four factors influencing trust on the other. Trust in physicians is based more on notional constructs, such as assurance of treatment (b=0.714, p<0.001) and respect for the physician (b=0.763, p<0.001),than objective assessments, such as the physician’s competence (b=0.607, p<0.001). Feeling comfortable with the physician (b=0.630, p<0.001) and the physician’s communication skills (b=0.253, p<0.001) significantly influence the level of trust. The former is correlated with the personal involvement of the physician (r=0.124, p<0.001), and so is the latter (r=0.152, p<0.001). The overall model has a good statistical fit. The factors that give rise to trust in physicians vary with the sociocultural context.
Introduction
Trust is defined as the patient’s optimistic acceptance of vulnerability in the belief that the physician will do only what is best for the patient (1). It is an unwritten covenant between the physician and the patient, inherent in the therapeutic relationship. Several scholars have explained the phenomenon of trust in healthcare. There seems to be a consensus that trust is a contextual issue (2). The factors which determine trust in the physician, the healthcare providers or the health system as a whole depend on the cultural and environmental context.
Trust in healthcare is of high instrumental value. Physician–patient relationships characterised by a high level of trust increase adherence to treatment, improve follow-up, reduce unnecessary investigations, reduce the need for second opinions and consequently, reduce the overall cost of healthcare (3, 4, 5, 6). Trust also creates a placebo effect, which brings about an increase in self-reported well-being (1). Moreover, trust, being a substantive ethical principle, is of inherent ethical value in therapeutic relationships.
Studies from developed countries in the West have shown that trust in the physician has five main dimensions: fidelity, competence, honesty, confidentiality and global trust (7). Fidelity is the acceptance of and respect for the personhood, individuality and moral agency of a patient. Competence is the clinical skill, and the ability to make the correct diagnosis, prescribe appropriate treatment and avoid medical errors. Honesty is full disclosure and transparency. Confidentiality is maintaining the secrecy of the medical information of a patient. Finally, all those aspects of trust that are not included in the first four dimensions are clubbed into the domain of global trust (7).
However, studies from settings which have poor resources and unregulated health systems have shown slightly different domains of trust. A qualitative study from south India, conducted by the same research team that has carried out the research for this paper, found that the perceived competence of the physician, assurance of treatment, confidence in the physician, loyalty to him/her and respect for him/her were the main domains (8). However, the study could not quantify the extent of the importance attached by the community to each of these dimensions in defining trust.
Several factors which lead to an increase or a decrease in trust have been described. On the basis of the factors which influence trust in physicians, and on the basis of a quantitative survey in south India, our research team segmented the community into specific groups (9). The study showed that the community can be grouped into those who trust physicians on the basis of their level of comfort with them, those who trust them due to their personal involvement, and those who trust them because of their behavioural competence, and emotional factors. How much each of these factors contributed to the building or erosion of trust remained to be seen.
This study used data collected from a locally representative sample household survey from urban and rural Tamil Nadu to develop a conceptual model of trust in the physician–patient relationship. The study aimed at quantifying the extent to which each dimension contributed to the concept of trust, and the strength of the association between various factors and the trust in physicians.
Methods
Study design: A cross-sectional survey was conducted with the help of a structured questionnaire to understand the dimensions of trust and the factors influencing it.
Study setting: The study was carried out both in rural and urban settings in Tamil Nadu, a coastal state in south India that has some of the best health indicators in the country. The state’s public health system has been performing well and has won appreciation fromthe rest of the country, which considers it a role model (10). There is an equally powerful private healthcare system, consisting of private practitioners, clinics, nursing homes and hospitals. On the one hand, the quality of services provided in the public health system, though relatively better than elsewhere in the country, leaves a lot to be desired. On the other hand, the services provided by the private sector, though of superior quality, have led to an increase in the cost of healthcare and indebtedness due to out-of-pocket expenditure. Due to these factors, there is a potential deficit of trust in the healthcare system in the state.
Study participants: A sample of 625 adults living in four districts of Tamil Nadu was selected by a multistage sampling method. The sample size was calculated according to the heuristics for sampling in structural equation modelling (SEM) that there should be at least 20 observations per variable of analysis (11). Of the 32 districts of Tamil Nadu, four were initially selected by the simple random sampling method. Two of these were predominantly urban (Chennai and Tiruvallur) and two were predominantly rural (Dharmapuri and Kancheepuram). Four urban wards and eight rural blocks were selected from each district by the probability-proportional-to-size method. From each selected block/ward, 35–40 individuals were interviewed.
Variables: Based on the qualitative study on trust in physicians conducted in the same setting, described elsewhere, a set of five important domains explaining the concept of trust were identified. These were perceived competence of the physician, assurance of treatment, confidence in the physician, loyalty to him/her and respect for him/her (8). The investigator generated questions based on these domains. The questions would explore the meaning of trust in physicians ascribed by the community based on these identified domains. These items were checked for face validity by physicians, public health practitioners and a small sample of lay persons. Apart from this, there were questions on the factors influencing trust in physicians, also obtained from the qualitative exploration of trust in the same setting. These questions were grouped into heads such as feeling a sense of comfort with the physician; the physician’s behaviour, such as his/her displaying kindness, paying attention and having a smile on his/her face; the physician explaining the illness clearly to the patient; personal involvement of the physician, eg seeking to know the patient’s name and the details of his/her family; and a feeling of shared identity, including the physician’s understanding of the patient’s cultural values. In addition, there were questions on age, sex, education, occupation and area of residence, all of which are possible covariates of trust in the physician.
Data measurement: The questionnaire was developed and pilot-tested on 50 individuals. The questions were modified and finalised on the basis of the pilot study. The selected participants answered the questions on the basis of their experience with their primary care physician. The latter included a wide variety of physicians, some of whom were government doctors, some private practitioners, and some even unqualified and unregistered practitioners. No restrictions were placed on the type of physician selected because the subject under study was the participants’ notion of trust in “a physician”, and not in any particular type of physician.The respondents rated the statements on a five-point Likert scale between “Strongly agree” to “Strongly disagree”.
Bias reduction: In order to reduce selection bias, the sample was selected by a multistage probabilistic technique. Hospital-based sampling was avoided. The first author, along with two other trained investigators, administered the questionnaires. Though the primary investigator is a physician by profession, this was not made known to the respondents to avoid reporting bias. The possibility of interviewer bias was averted by using a standardised questionnaire and standardising the process of administering the questionnaire.
Fitting the structural model: SEM was used to gain conceptual clarity on trust in physicians, and to test the theoretical concept of trust that was gleaned from a review of the literature and previous qualitative studies. SEM refers to a group of statistical procedures, including regression, principal component and factor analysis, which help to test hypothetical complex relationships between observed and unobserved latent variables. Thus, SEM has two components: (i) the structural model which deals with the relationships between the latent, unobserved variables, and (ii) the measurements models which study the relationships between observed and unobserved variables. It compares the characteristics of the model with the empirical data and tests if the data fit the model. However, it is important to understand that SEM is not causal testing. When SEM shows that a model fits the empirical data, it does not imply causality. The greatest advantage of SEM is that it helps to study latent and abstract constructs such as trust. The other big advantage of SEM is the graphical representation that the path diagram provides; this helps to visualise the relationships between latent variables. SEM is a powerful tool, but should be handled with care because it is prone to a number of errors. For example, rarely can all observed variables be fitted into simple regressions with latent variables. This is a basic assumption of SEM and if not met, it can lead to serious errors in the interpretation of the results. Throughout the process of fitting the model, one has to be extremely particular about keeping the theoretical construct and the meaning in mind. Sometimes, modification indices suggest error correlations between variables that may not have any meaning. This is something SEM analysts should be careful about. The statistical assumptions required for performing SEM analysis are prohibitively strict and, therefore, fitting a good structural equation model is very difficult (12, 13).
Our qualitative exploration of trust in physicians in the same area (8) formed the basis of a conceptual framework. To validate this framework, a hypothetical SEM was fitted on the basis of this framework. Trust in physicians was the key latent variable. Twelve items with a bearing on the domains of perceived competence, treatment assurance, confidence, respect and loyalty were included as reflective variables, contributing to the latent variable trust. The previous qualitative exploration had also identified certain factors influencing trust in physicians. These were shared identity, behaviour of the physician, personal involvement of the physician and comfort with the physician. These factors were added to the structural model as independent latent variables, contributing to the dependent latent variable “trust in physicians”. Other variables, such as age, sex, education, occupation and area of residence, were also included in the model as endogenous variables.
Testing for statistical assumptions: Before carrying out the measurements, important assumptions of SEM were considered. The study did not meet the conditions for causality as it was a cross-sectional assessment and temporality was not demonstrated. Only those factors which were identified in the qualitative exploration were included in the model. Other confounding variables or unknown factors that could not be identified were not included in the model. The direction of proposed causal relationships was not exclusive. For example, it is possible that a high level of comfort would increase trust and this increase in trust would contribute to greater comfort. Despite these limitations in the assumptions of SEM, the model was fit to explore hypothetical associations and quantitatively validate the findings of the qualitative exploration. The data were arranged in an ordinal Likert-type scale. They were assumed to be continuous for the purpose of analysis. The variables were checked for normality and linearity. Based on the acceptable skewness and kurtosis values suggested by West et al. for fitting structural equation models with non-normal data, the model was assumed to be normal (14). The model fit statistics were computed with this assumption of normality. The Standardized Root Mean Square Residual (SRMR), Root Mean Square Error Approximation (RMSEA), and Comparative Fit Index (CFI) were used to assess the model fit. An SRMR of less than 0.09, an RMSEA of less than 0.06 and a CFI of more than 0.90 were considered adequate criteria for a good model fit (15). To obtain more robust regression estimates, bootstrapping was done and the confidence intervals of the estimates were calculated using the bias-corrected percentile method. The Bollen-Stine bootstrap model fit Chi Square was also calculated to further test the model fit. After the construction of the structural equation model, two measures were adopted to improve the model fit. First, variables which did not contribute significantly to the factor, both conceptually and statistically, were sequentially removed. Second, meaningful error covariance was introduced between variables in the same factor on the basis of modification indices reported by the programme. All SEM analysis was performed using the statistical software IBM Amos version 20 (16).
Ethical considerations: The study was reviewed by the institutional review board and ethics committee of the School of Public Health, SRM University and approved. Informed consent was obtained verbally from the participants after they had been given thorough information on the study. This was approved by the ethics committee. The process of informed consent was documented in the study information sheet, which was part of the questionnaire that was administered to the respondents. The participants were not asked to sign on the informed consent sheets since during the previous studies conducted by the authors, obtaining signatures and thumb impressions from the members of these marginalised communities was perceived of as a bureaucratic procedure. The word “marginalisation” here refers to poverty and poor access to healthcare. The ethics committee approved the procedure of not obtaining the participants’ signature, provided that a neutral witness, who was not related to the study or the study team, was present and the process was documented. Strict privacy and confidentiality of information was maintained throughout the study.
| Table 1: Characteristics of study participants (n=616)(23–25) | |||
| Characteristic | Categories | Frequency (percentage) | Characteristics of Tamil Nadu population |
| Age | 18–25 | 158 (25.3%) | 19% |
| 26–35 | 204 (32.6%) | 16.7% | |
| 36–45 | 104 (16.6%) | 14% | |
| 46–55 | 85 (13.6%) | 10% | |
| 56–65 | 45 (7.2%) | 7% | |
| >65 | 29 (4.6%) | 5% | |
| Sex | Male | 252 (40.9%) | 50.2% |
| Female | 364 (59.1%) | 49.8% | |
| Place of residence | Urban | 124 (20.1%) | 48.45% |
| Rural | 501 (79.9%) | 51.55% | |
| Education | No formal education | 89 (14.4%) | Literate–73.8% |
| Schooling | 270 (43.8%) | Illiterate–26.2% | |
| Graduation | 135 (21.9%) | ||
| Postgraduate and professional | 122 (19.8%) | ||
| Occupation | Service sector | 165 (26.8%) | 22% |
| Home-maker | 159 (25.9%) | * | |
| Labourer | 92 (15%) | 26% | |
| Unemployed | 72 (11.7%) | * | |
| Professional | 42 (6.8%) | 8% | |
| Agricultural land owner | 38 (6.2%) | 40% | |
| Business | 30 (4.9%) | 8% | |
| Skilled worker | 17 (2.8%) | * | |
*Data not available
Results
A total of 625 individuals participated in the survey. The data were incomplete in the case of nine of the samples, which could thus not be included in the analysis. The characteristics of the respondents whose data were analysed are shown in Table 1. As compared to the characteristics of the general population of Tamil Nadu, women, the rural population, and well-educated people find greater representation in the sample.
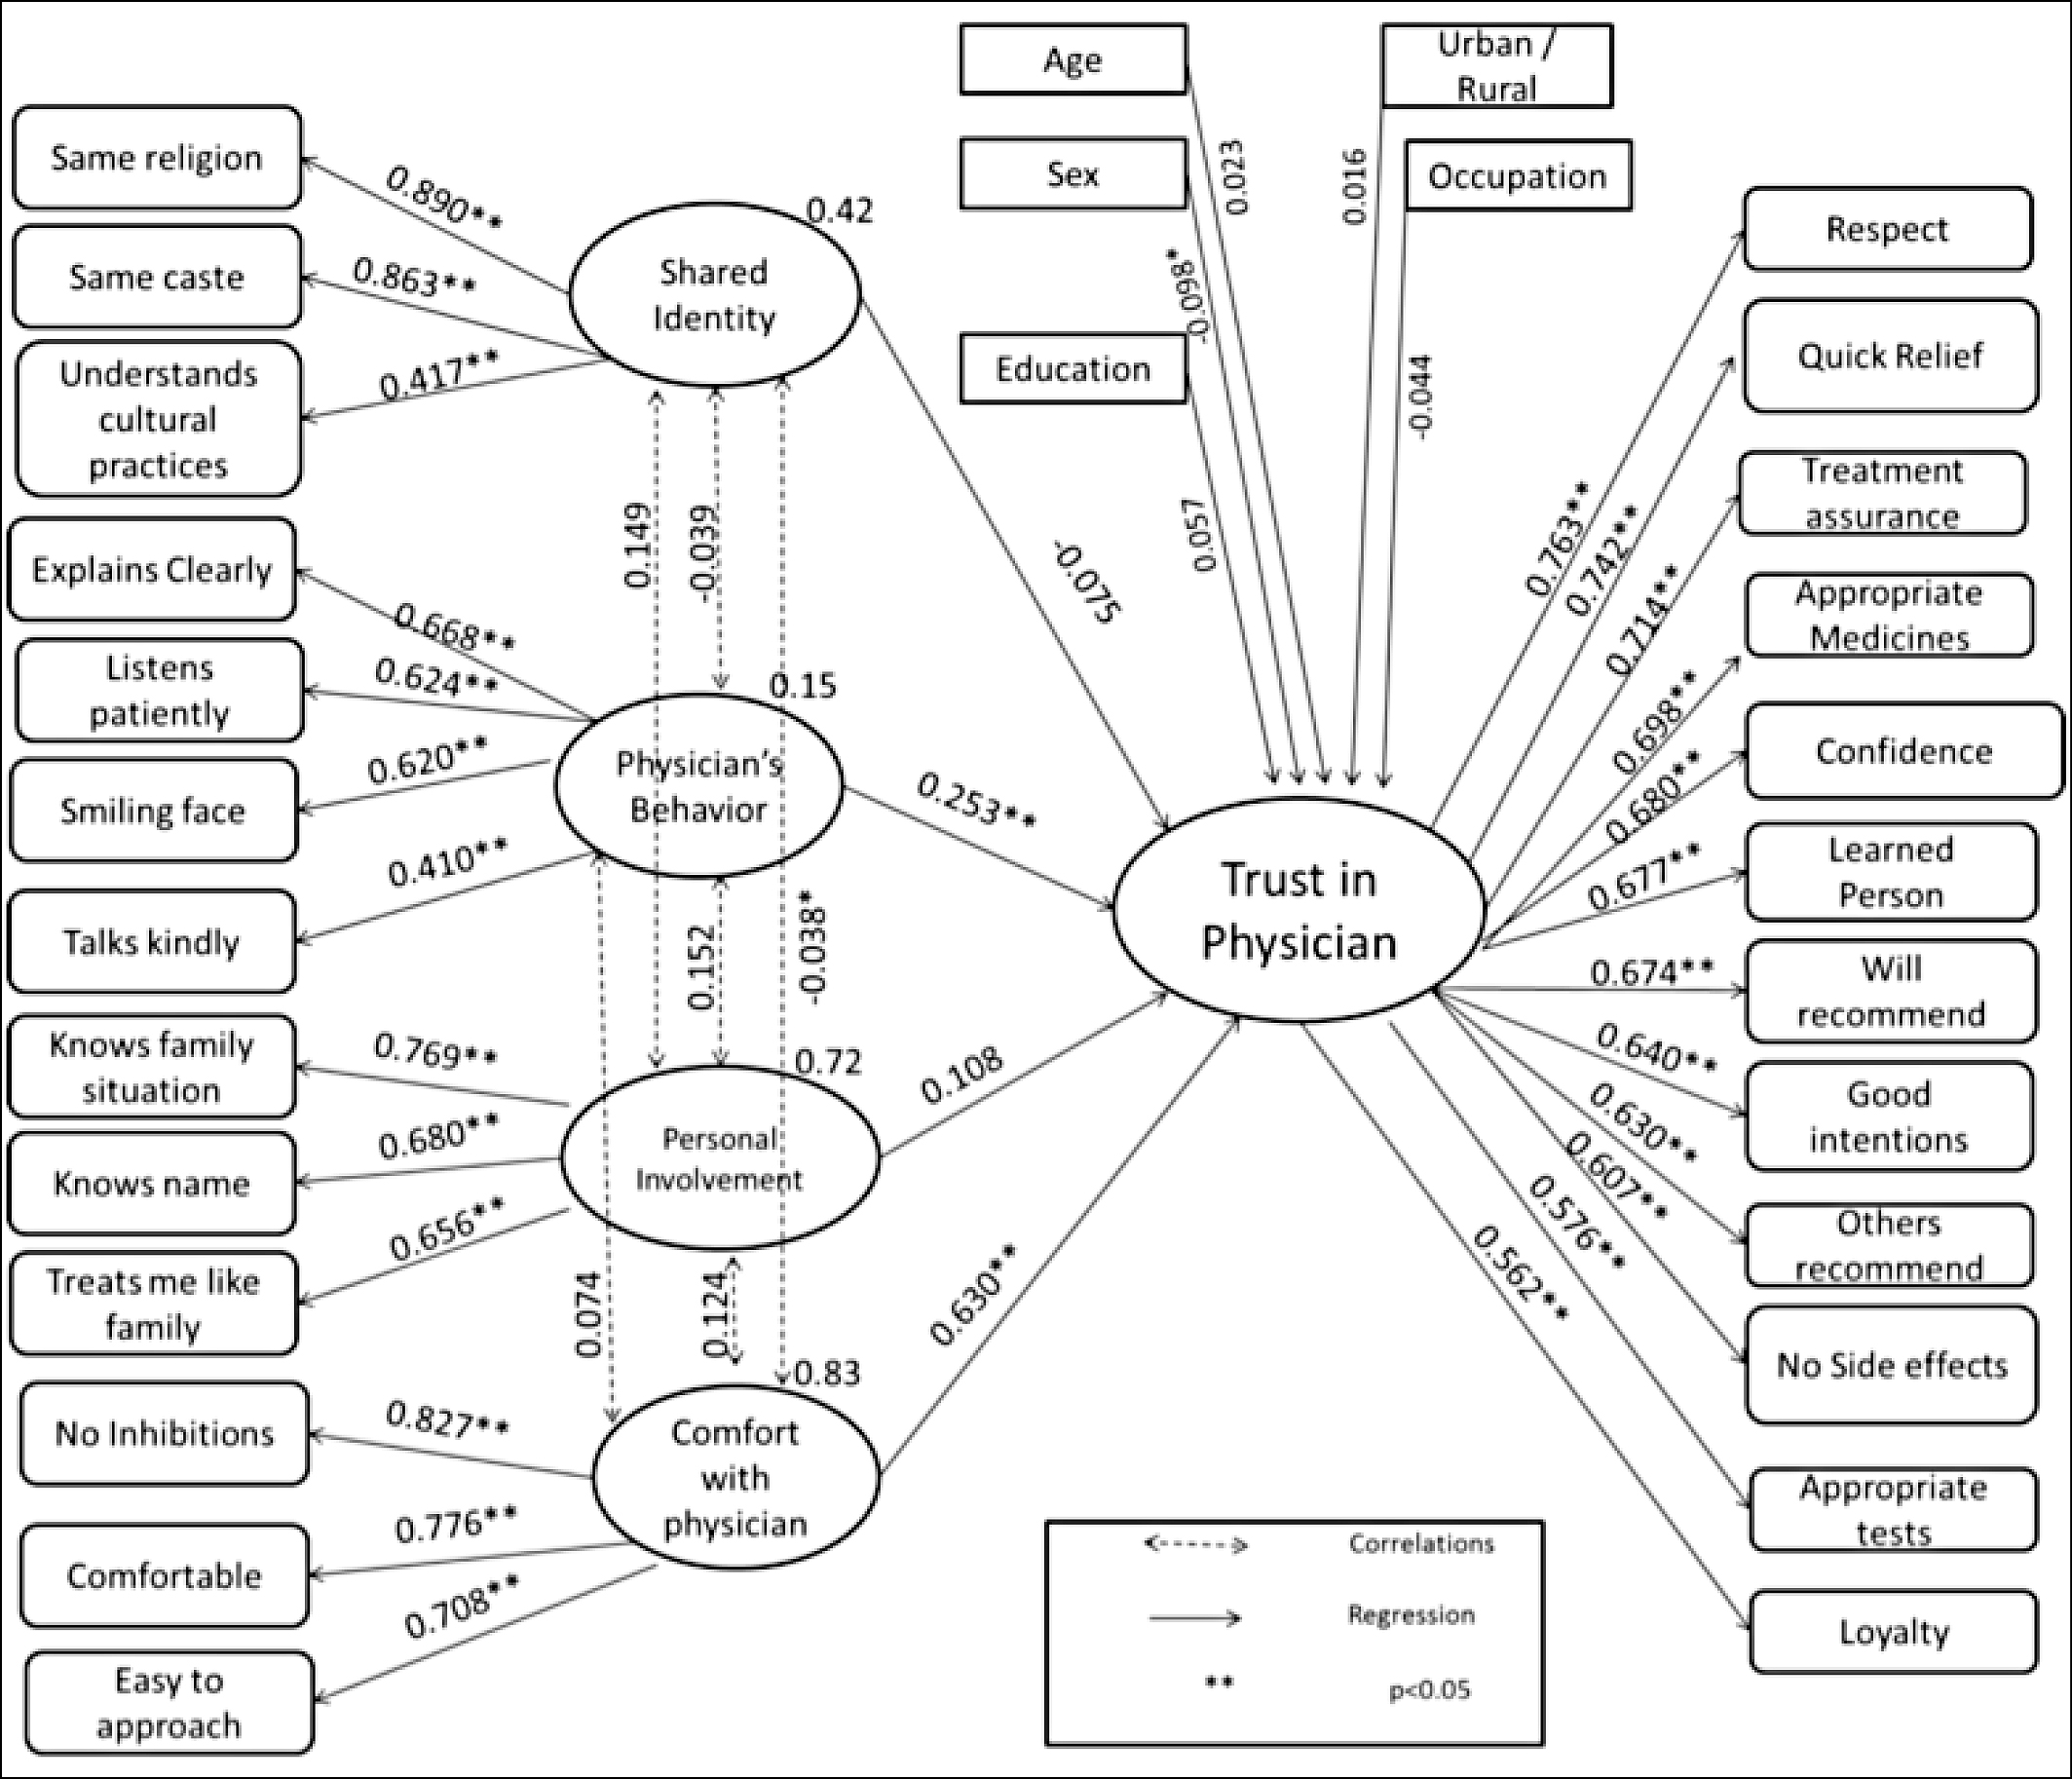
The final structural equation model is depicted in Figure 1. The regression coefficients of each of the 12 component statements’ contribution to the construct of trust in physicians. The sex of the patient (b=-0.098) had a significant influence on trust. Women had less trust in physicians than did men. The other socio-demographic factors did not have a significant influence on trust in the physician. Trust in physicians is related more to notional constructs, such as assurance of treatment (b=0.714, p<0.001) and respect for the physician (b=0.763, p<0.001), than objective assessments, such as that of the competence of the physician (b=0.607, p<0.001). The level of comfort with the physician (b=0.630, p<0.001) and his/her communication skills (b=0.253, p<0.001) significantly influence the degree of trust. The level of comfort with the physician is correlated with his/her personal involvement in the case (r=0.124, p<0.001) and the physician’s communication skills are correlated with his/her personal involvement (r=0.152, p<0.001). Table 2 shows the standardised regression coefficients, bootstrap confidence intervals and p values for each association in the model. The inter-correlations between the four factors influencing trust in the physician are shown in Table 3.
The final model had an SRMR of 0.044, RMSEA of 0.043 (90%CI 0.039–0.050), and CFI of 0.942, all indicating a good model fit. The Bollen-Stine chi-square p value was <0.01. However, since this chi-square is sensitive to high sample size, this was not considered a criterion for rejecting the model.
| Table 2: Structural equation model of trust in physicians – standardised regression weight and bootstrap confidence intervals | |||||
| Independent variable | Dependent variable | Standardised
regression weights |
Bootstrap CI | Bootstrap
p value |
|
| Lower Limit | Upper Limit | ||||
| Trust | Comfort | 0.630 | 0.519 | 0.725 | 0.001 |
| Trust | Emotional | -0.075 | -0.157 | 0.017 | 0.134 |
| Trust | Behavioural | 0.253 | 0.139 | 0.368 | 0.001 |
| Trust | Personal involvement | 0.108 | -0.005 | 0.213 | 0.061 |
| Trust | Education | 0.057 | -0.033 | 0.155 | 0.197 |
| Trust | Occupation | -0.044 | -0.129 | 0.045 | 0.318 |
| Trust | Age | 0.023 | -0.054 | 0.099 | 0.526 |
| Trust | Sex | -0.098 | -0.181 | -0.017 | 0.021 |
| Trust | Rural, urban | 0.016 | -0.053 | 0.091 | 0.596 |
| Same religion | Shared Identity | 0.890 | 0.833 | 0.950 | 0.001 |
| Same caste | Shared Identity | 0.863 | 0.794 | 0.918 | 0.001 |
| Understands
beliefs apractices |
Shared Identity | 0.417 | 0.344 | 0.486 | 0.001 |
| Explains clearly | Behavioural | 0.668 | 0.570 | 0.750 | 0.002 |
| Listens patiently | Behavioural | 0.624 | 0.522 | 0.714 | 0.001 |
| Smiling face | Behavioural | 0.620 | 0.523 | 0.703 | 0.001 |
| Talks kindly | Behavioural | 0.410 | 0.299 | 0.525 | 0.001 |
| No inhibitions | Comfort | 0.827 | 0.775 | 0.873 | 0.001 |
| Comfortable | Comfort | 0.776 | 0.703 | 0.837 | 0.001 |
| Easy to approach | Comfort | 0.708 | 0.639 | 0.771 | 0.001 |
| Knows family situation | Personal involvement | 0.769 | 0.701 | 0.824 | 0.001 |
| Knows name | Personal involvement | 0.680 | 0.601 | 0.748 | 0.002 |
| Treats me like family | Personal involvement | 0.656 | 0.580 | 0.730 | 0.001 |
| Respect | Trust | 0.763 | 0.708 | 0.810 | 0.001 |
| Quick cure | Trust | 0.742 | 0.670 | 0.795 | 0.001 |
| Treatment assurance | Trust | 0.714 | 0.641 | 0.777 | 0.001 |
| Gives appropriate medicines | Trust | 0.698 | 0.616 | 0.756 | 0.002 |
| Confidence in physician | Trust | 0.680 | 0.605 | 0.740 | 0.001 |
| Learned person | Trust | 0.677 | 0.601 | 0.742 | 0.001 |
| Will recommend this doctor | Trust | 0.674 | 0.613 | 0.730 | 0.001 |
| Intention of doctor is good reatment | Trust | 0.640 | 0.560 | 0.708 | 0.001 |
| Others recommend doctor | Trust | 0.630 | 0.556 | 0.699 | 0.001 |
| No side-effects of medicines | Trust | 0.607 | 0.527 | 0.675 | 0.001 |
| Does appropriate tests | Trust | 0.576 | 0.492 | 0.651 | 0.001 |
| Loyalty | Trust | 0.562 | 0.492 | 0.623 | 0.001 |
| Table 3: Correlation between the factors influencing trust in physicians | |||
| Factor influencing trust | Factor influencing trust | Correlation coefficient | p value |
| Shared identity | Behavioural | -0.039 | 0.005 |
| Shared identity | Comfort | -0.038 | 0.183 |
| Shared identity | Personal involvement | 0.149 | <0.001 |
| Behavioural | Comfort | 0.074 | <0.001 |
| Behavioural | Personal involvement | 0.152 | <0.001 |
| Comfort | Personal involvement | 0.124 | 0.002 |
Discussion
Summary of key findings
This structural equation model was fit to quantify the extent to which various dimensions defined the construct of trust and the contribution of various factors to trust-building. The study found that the 12 statements which covered the five domains of trust named earlier described trust in physicians in this context. Among these, notional constructs, such as assurance of treatment and respect, had more contribution to the definition of trust than objective assessments, such as assessments of competence. Among the factors influencing trust, shared identity and personal involvement with the patient did not influence trust, but the communication skills of the physician (behaviour) and one’s level of comfort with the physician did. There was a significant correlation between the factors of the level of comfort, the behaviour of the physician and his/her personal involvement. Women had less trust in physicians than did men, but other socio-demographic covariates did not influence trust.
Dimensions of trust in physicians
A detailed review of trust in physicians in settings indeveloped countries in the West identified five important dimensions of trust: fidelity, competence, confidentiality, honesty and global trust (7). A qualitative study carried out in the same area as this study showed that the dimensions in this setting are the perceived competence of the physician; assurance of treatment, irrespective of the time of day or ability to pay; a feeling of confidence that one’s condition will improve; respect for the physician; and loyalty to him/her. Yet another important dimension was the willingness to accept shortcomings such as rude behaviour and the high cost of care (8). This quantitative analysis tried to quantify the extent to which each of these domains of trust can contribute to our understanding of trust in physicians. It also attempted to validate the theoretical construct of trust in physicians obtained by the qualitative study. According to this analysis, the statements representing all the important domains identified in the qualitative study described the construct of trust in physicians in a unidimensional manner. The notions of respect for the physician and assurance of treatment contributed more to the definition than the perceived competence of the physician. In these settings, the nature of trust in physicians is determined by low socioeconomic status, poor access to health facilities, few options to choose from in terms of healthcare providers in the remote, inaccessible areas, and poor awareness of health matters. In this context, the people have great respect for the physician. This is the main reason why the trust discourse is dominated by the language of respect. As for uncertainty of access to healthcare services in the public sector and high out-of-pocket expenditure on healthcare in the private sector, assurance of treatment has emerged as an important dimension of trust in these areas as well. This is closely followed by perceived competence. However, unlike developed healthcare settings in which competence is the primary factor defining trust, it is given lower priority in these settings.
Factors influencing trust in physicians
Feeling comfortable with the physician, shared identity in terms of belonging to the same religion or caste or having common cultural practices, personal involvement in terms of knowing the patient by name, knowing the family details and treating the patient like one’s own family member, and finally, communication skills, including giving clear explanations about the illness and treatment, dealing with the patient with a smiling face, and displaying kindness and patience were identified as factors influencing trust in physicians.
A study in the USA showed that trust in physicians was influenced by certain types of behaviour on the physician’s part. These were exploring the patient’s disease and experience of illness, and spending more time with the patient (17). Physicians who acted comforting and caring, demonstrated competency, encouraged and answered questions, and explained the disease and treatment also won the trust of their patients (18). Giving patients enough time to explain the reason for their visit, answering their questions in an understandable manner, taking enough time to answer their questions, enquiring about the effect of the family situation on their health, involving them in decision-making and providing them with as much medical information as they want were determinants both of trust in the physician as well as satisfaction (19). This study also found that positive communication skills, such as displaying patience and kindness and dealing with the patient with a smiling face, were important in building relationships characterised by trust.
A recent study showed that honest signals, indicating genuine intent, could be perceived by the patients through the communication of the doctor and pave the way for the establishment of trust (20). Thus, good behaviours and positive communication on the physician’s part have a strong influence on the development of trust in healthcare settings. The types of behaviour that influence trust in physicians need to be explored in greater detail. As mentioned already, a feeling of comfort is one of the factors associated with trust. A high level of comfort with the physician could lead to greater participation by patients in clinical decision-making, a better understanding of the treatment, an improvement in the healing process and hence, greater trust in the physician.
This study failed to show a statistically significant association between personal involvement and trust. However, other studies have shown that personal involvement of physicians in the care of patients strongly influences trust. In 1927, Frances Weld Peabody of Boston City Hospital said, “The treatment of a disease may be entirely impersonal; the care of the patient must be completely personal. The significance of the intimate personal relationship between physician and patient cannot be too strongly emphasised, for in an extraordinarily large number of cases both diagnosis and treatment are directly dependent on it” (21). This emphasises the importance of personal involvement of the physician with the patient. The previous qualitative exploration undertaken in this area had shown that personal involvement of the physician increased trust among patients, but the current analysis found no such association. There could be several reasons for this. It is probably not possible for physicians to get personally involved in settings characterised by overcrowded hospitals and outpatient services, rotation of doctors (in public health facilities), and lack of continuity of care. Moreover, the concept of the family physician is eroding and there are fewer opportunities to establish long-lasting relationships with the physician. Nevertheless, it is important to assess this dimension in greater detail and understand its dynamics in such settings.
A previous quantitative study which tried to segment the community on the basis of the factors that influenced their trust in physicians identified that shared religion, caste and cultural identity increased the levels of trust (9). Our study found that these factors did not significantly influence trust. Young people comprised a greater proportion of the study sample, and their levels of educational attainmentwere relatively higher. The educated and younger groups tend to lay less emphasis on caste, religion and culture even in rural and underdeveloped areas. This is probably reflected in the findings.
The physician’s behaviour and personal involvement with the patient were strongly correlated with each other. Both are reflective of the inter-personal skills of the physician. The physician’s personal involvement was correlated with the patient’s comfort level with the physician, as greater personal involvement leads to greater comfort levels. There was a very weak correlation between the physician’s behaviour/communication skills and the patient’s comfort level with the physician, which indicates that they operated as separate factors influencing trust. While both reflect the inter-personal skills of the physician, behaviour and communication skills can be practised and taught, whereas feeling comfortable with a physician is more abstract and reflects his/her personality.
When studying the influence of socio-demographic variables on trust in the physician, it was noted that women tend to trust physicians less than men. A study conducted in northern India yielded similar results (22). This gender differential in trust has potential implications for the treatment-seeking behaviour of women. Though a recent study showed that the elderly and socioeconomically backward people had greater levels of trust in physicians, our study did not corroborate this (20). None of the other socio-demographic variables, such as age, education, occupation or urban/rural status, had an influence on trust. This indicates that trust in physicians is a universal phenomenon in these settings. However, the factors influencing trust may vary according to the patient’s level of education or occupation, as was observed in the previous quantitative study (9).
As is the case with any cross-sectional study, it is not possible to establish a temporal association between the factors influencing trust and trust in physicians. One cannot clearly define whether trust in physicians leads to comfort or whether it is the other way round. It is also true that trust in a physician could reinforce his/her positive behaviour, communication skills, personal involvement and efforts to make the patient comfortable. These dynamics are very complicated and it is not easy to tease them out from cross-sectional quantitative surveys. This study has explored only some of the attributes of physicians that influence trust and has placed the focus of trust entirely on the physician. There are several important characteristics of the physician, such as age, gender and experience, which can influence trust. These were not included in the model. Moreover, a component of the patient’s trust in a physician is influenced by the institution in which he/she practises. This is called institutional trust and was also not studied in this model. It is important to understand that trust in the physician may also be influenced by patient-related attributes, such as the nature of the illness and the personality traits of the patient. Future studies should employ a more comprehensive model that includes the physician’s characteristics, institutional characteristics as well as patient’s characteristics. Moreover, the SEM methodology used here has highly prohibitive assumptions. Its use in the case of sociological constructs such as trust, the dynamics of which are complicated, as described above, can only yield preliminary results that are in the nature of suggestions. This model cannot be considered confirmatory. At most, it confers tentative construct validity to the concept of trust as captured by the 12 items measured in the study.
There is a need for further studies that explore the phenomenon of trust from a longitudinal perspective in different settings. The various attributes of physicians and patients that possibly influence trust in the physician should also be assessed in detail. There is also a need to examine the consequences of relationships of trust between doctor and patient in these sociocultural settings.
Conclusion
Trust in physicians is a dynamic construct which varies according to the sociocultural context. The major finding of this study is that in settings with a low level of awareness of health, resource deprivation and the absence of universal access to healthcare, trust in physicians is largely influenced by respect for the physician and assurance of treatment, rather than objective assessments, such as the physician’s competence. The behaviour/communication skills of the physician and the level of comfort with him/her seem to influence the degree of trust. If we can gain a good understanding of the factors that lead patients to trust physicians, it will help us develop trust as an indicator of the quality of healthcare delivery. It will also help in objective assessments of trust for further research purposes.
Acknowledgements
The authors acknowledge the statistical inputs of Professor M Bagavandas, Professor of Statistics, School of Public Health, SRM University and Professor Mala Ramanathan, Professor, Achuta Menon Centre for Health Sciences Studies, Sri Chitra Tirunal Institute of Medical Sciences and Technology, Trivandrum.
The first author, VG, is supported by the INSPIRE Fellowship of the Department of Science and Technology, Government of India.
Data sharing statement
This paper is part of the larger PhD research project by the same author and it has led to three prior publications on similar themes, two of which have been referenced in this paper (references 8 and 9). The author has also written a previous editorial in the same journal with a similar theme.
References
- Caterinicchio RP. Testing plausible path models of interpersonal trust in patient–physician treatment relationships. Soc Sci Med Med Psychol Med Sociol. 1979;13:81-99.
- Goudge J, Gilson L. How can trust be investigated? Drawing lessons from past experience. SocSci Med. 2005;61:1439-51.
- Lee YY, Lin JL. The effects of trust in physician on self-efficacy, adherence and diabetes outcomes. Soc Sci Med. 2009;68:1060-8.
- Bonds DE, Camacho F, Bell RA, Duren-Winfield VT, Anderson RT, Goff DC. The association of patient trust and self-care among patients with diabetes mellitus. BMC Fam Pract. 2004;5:26.
- Cunningham PJ. High medical cost burdens, patient trust, and perceived quality of care. J Gen Intern Med. 2009;24:415-420. 10.1007/s11606-008-0879-3 [doi].
- Piette JD, Heisler M, Krein S, Kerr EA. The role of patient-physician trust in moderating medication nonadherence due to cost pressures. Arch Intern Med. 2005;165:1749-55.
- Hall MA, Dugan E, Zheng B, Mishra AK. Trust in physicians and medical institutions: what is it, can it be measured, and does it matter? Milbank Q. 2001;79:613-39.
- Gopichandran V, Chetlapalli SK. Dimensions and determinants of trust in health care in resource poor settings –aqualitative exploration. PloS One. 2013;8:e69170.
- Gopichandran V, Chetlapalli SK. Factors influencing trust in doctors: a community segmentation strategy for quality improvement in healthcare. BMJ Open. 2013 Dec 2;3(12):e004115.
- Statistics Division, Ministry of Health and Family Welfare, Government of India. Rural Health Statistics in India 2012 [Internet]. New Delhi; MoHFW; 2012 [cited 2015 Jun 30]. Available from: http://mohfw.nic.in/WriteReadData/l892s/492794502RHS%202012.pdf
- Bartlett JE, Kotrlik JW, Higgins CC. Organizational research: determining appropriate sample size in survey research appropriate sample size in survey research. Information Technology, Learning, and Performance Journal.2001;19:43-50.
- Nachtigall C, Kroehne U, Funke F, Steyer R.(Why) should we use SEM? Pros and cons of structural equation modeling. Methods of Psychological Research Online. 2003;8:1-22.
- Byrne BM. Structural equation modeling with AMOS: basic concepts, applications, and programming. New York: Routledge; 2010.
- West SG, Finch JF, Curran PJ. Structural equation models with nonnormal variables: problems and remedies. In: Hoyle RH (ed). Structural equation modeling: concepts, issues and applications. Newberry Park, CA: Sage;1995: pp. 56-75.
- Hooper D, Coughlan J, Mullen MR. Structural equation modelling: guidelines for determining model fit. Electronic Journal of Business Research Methods 2008;6(1):53-60.
- Arbuckle JL. IBM SPSS Amos Version 20, 2011.
- Fiscella K, Meldrum S, Franks P, Shields CG, Duberstein P, McDaniel SH, Epstein RM. Patient trust: is it related to patient-centered behavior of primary care physicians? Med Care. 2004;42:1049-55.
- Thom DH; Stanford Trust Study Physicians.Physician behaviors that predict patient trust. J Fam Pract. 2001;50:323-8.
- Keating NL, Green DC, Kao AC, Gazmararian JA, Wu VY, Cleary PD. How are patients’ specific ambulatory care experiences related to trust, satisfaction, and considering changing physicians? J Gen Intern Med. 2002;17:29-39.
- Riva S, Monti M, Iannello P, Pravettoni G, Schulz PJ, Antonietti A. A preliminary mixed-method investigation of trust and hidden signals in medical consultations. PloS One. 2014;9:e90941. doi:10.1371/journal.pone.0090941.
- Peabody FW. The care of the patient. JAMA. 1927;88:877-82.
- Banerjee A, Sanyal D. Dynamics of doctor–patient relationship: a cross-sectional study on concordance, trust, and patient enablement. J Family Community Med. 2012;19:12-19. 10.4103/2230-8229.94006 [doi];JFCM-19-12 [pii].
- Navaneetham K, Dharmalingam A. Demography and development: preliminary interpretations of the 2011 census [commentary]. Econ Pol Wkly. 2011;46:13-17.
- Dyson T. The preliminary demography of the 2001 census of India. Popul Dev Rev. 2001;27:341-56.
- Chowdhury S. Employment in India: what does the latest data show? [commentary]. Econ Pol Wkly. 2011;46:23-6.