COMMENTS
Finding and using evidence that you can trust
Prathap Tharyan
DOI: https://doi.org/10.20529/IJME.2012.007
Abstract
Much of the evidence-base from research is biased. Systematically assembled, quality-appraised, and appropriately summarised reviews of the effects of interventions from all relevant intervention studies are needed, in order to use research evidence to reliably inform health decisions. The Cochrane Library is an online collection of six searchable, up-to-date, evidence-based databases that is available free to access by anyone in India, thanks to a national subscription purchased by the Indian Council of Medical Research. This valuable resource contains the world’s single largest collection of systematic reviews and controlled clinical trials, as well as bibliographic details and records of methodological research, health technology assessments and economic analyses. The robust and transparent methods pioneered and used in Cochrane systematic reviews, and independence from industry funding facilitate the detection of biased, deceptive and fraudulent research, and have earned these reviews the reputation of being trusted sources of evidence to inform health decisions. Cochrane reviews have had considerable impact on academic medicine; have informed health practices, policies and guidelines; improved health outcomes; and saved numerous lives.
An editorial in the previous issue of this journal summarised the results of empirical research revealing that much of the evidence from research that is integral to the practice of evidence-based medicine cannot be trusted (1). This does not mean that none of the evidence can be trusted. However, it does require a special effort to identify sources of reliable evidence, to understand how this should be assessed, and the amount of confidence one can place in this evidence.
Finding the right evidence
The first step in evidence-informed healthcare is to find relevant evidence that is free of the risk of bias. Randomised controlled trials (RCTs) are considered the type of study design that is least likely to provide biased estimates when assessing the effects of interventions. However, the language of research facilitates deception, through the use of descriptive terms that are widely employed to describe studies that have not necessarily used, or used adequately, the methods required to provide “Gold Standard” evidence that RCTs are assumed to provide (2, 4). Moreover, the results of a single RCT are unlikely to be generalisable to all situations where the intervention may be used. The results of different RCTs of the same intervention and control comparison may also differ substantially.
The least biased evidence that addresses these issues regarding the effects of interventions comes from well-conducted systematic reviews and meta-analyses of all RCTs conducted that compare an intervention to no intervention (or placebo), and to other interventions commonly used for that health condition. If RCTs are not ethical, practical, or feasible, then systematic reviews of particular types of well-conducted observational studies could provide alternative sources of evidence.
Systematic reviews use explicit and systematic methods to search for, locate, and retrieve; critically appraise for the risk of bias; reliably extract and analyse data from all relevant research studies addressing a focused clinical question, and summarise the overall results. They, therefore, provide information that individual trials cannot. Many systematic reviews, though not all, synthesise their results using meta-analyses. Meta-analysis is the statistical technique that aggregates the numerical data for each relevant outcome from the primary studies that are sufficiently similar in their participants, interventions, methods, and outcomes to combine in a clinically meaningful manner.
Systematic reviews in the Cochrane Database of Systematic Reviews (CDSR), one of six evidence-based databases that form part of The Cochrane Library (www.thecochranelibrary.com), are particularly reliable sources of evidence, as are systematic reviews that use the methods pioneered by the Cochrane Collaboration (www.cochrane.org). The resources in The Cochrane Library are free to access by anyone in India with a computer and an internet connection, thanks to a national subscription purchased by the Indian Council of Medical Research (ICMR) since 2007, and renewed for a further three years in 2010. More than half the world’s population also has free access to this valuable resource due to various sponsored initiatives or licensing agreements (5).
The impact of Cochrane systematic reviews
Only about 20% of reviews published each year are Cochrane systematic reviews. However, empirical research reveals that Cochrane systematic reviews are scientifically more rigourous, more likely to be up to date, and less biased in their methods and interpretation than non-Cochrane systematic reviews (6, 7). The 2010 impact factor for the CDSR was 6.186. The CDSR is now ranked in the top 10 of the 151 journals in the medicine, general, and internal category, and receives the seventh highest number of citations in its category.
Other more important examples of the impact of Cochrane reviews include informing the guidelines of many agencies, including those of the World Health Organisation, and influencing global, national and regional health policies. Cochrane reviews in many topic areas have provided clinicians, patients and their care-givers access to reliable evidence that have improved health outcomes and saved numerous lives.
Why are Cochrane systematic reviews and meta-analyses regarded as reliable sources of evidence?
The major reasons that contribute to the reliability of Cochrane systematic reviews stem from the rigourous methods used in their preparation. These methods are described in the Cochrane Handbook for Systematic Reviews of Interventions (www.cochrane-handbook.org/). They include:
- Transparent, reproducible methods: Systematic reviews commence with a methods section or protocol that is unusual in traditional review articles. Protocols of Cochrane systematic reviews are peer-reviewed, editorially vetted and published online in the CDSR before the review commences. The protocol outlines in detail the scope and methods planned for undertaking the review.
- Striving for relevance: The topics selected for Cochrane systematic reviews are agreed in advance by the authors and editorial team as relevant to health care, and are often selected in response to the expressed needs of relevant stakeholders. Cochrane review topics cover not only pharmacological interventions but a variety of non-pharmacological interventions and aspects of health-service delivery. The pre-stated primary outcomes in Cochrane reviews may not be the primary outcomes used in the included trials. Thus, the primary outcome of a systematic review that compared reduced osmolality oral rehydration solution (ORS) versus the WHO-recommended, standard ORS to treat acute dehydration due to diarrhoea in children, was the frequency of unscheduled intravenous saline infusions used. This was considered by the review team as a real-world indicator of the failure of either solution to effectively treat diarrhoea (8). This was not a primary efficacy outcome in most of the 11 included trials and was obtained not from the description of the main results or tables, but from elsewhere in the paper; in three other included trials, it was not reported. In this review, reduced osmolality ORS required significantly fewer unscheduled intravenous saline infusions than standard ORS, and is now the recommended standard. Many other examples exist where Cochrane reviews have challenged the received wisdom and changed established practices and health policy by demonstrating that interventions in common use were ineffective (9, 13) or even harmful (14, 16).
- Comprehensive search strategy: Systematic reviews attempt to locate all relevant studies that have addressed the review’s objectives, and not only a biased sub-set of published studies, or ones that were easily available. Empirical research has demonstrated that studies published in journals are more likely to show statistically significant results; be published in high-impact, mostly English-language journals; be sponsored by the pharmaceutical industry and, be published sooner than unpublished studies (17, 18). If one were to rely only on the results of these published trials, without balancing the evidence from unpublished trials (often smaller and with negative or inconclusive results), one would be seriously misled (19).
- Minimising biases in the review process: The review teams are assembled to balance the views of all authors and to avoid financial and academic conflicts.Bias in selecting trials is minimised in Cochrane reviews by involving at least two authors who independently apply pre-stated, explicit inclusion and exclusion criteria. They also independently assess quality; extract data and contribute to writing the results and discussion. Disagreements are resolved by discussion or contacting authors of trials. Inputs are provided from two editors, a lay reviewer and peer reviewers. Excluded studies are listed with reasons for exclusion; studies awaiting assessment are also listed, and ongoing trials are described. Any changes between the published protocol and the final review are documented, discussed, and justified. Authors are supported by editorial teams from conception, through development, completion, and publication of the review, and upto updating of the review, ideally every two years, or when new trials are located or published.
- Minimising conflicts of interest: The Cochrane Collaboration’s polices prohibit industry funding of review teams or collaborative review groups and methods groups earning Cochrane reviews the reputation of being independent sources of reliable evidence.
- Assessing the risk of bias in included studies: Including studies at high risk of bias that are likely to have erroneous effect estimates, are unpredictable in magnitude and direction (20), will result in systematic reviews with misleading results. Hence, RCTs are preferred in most Cochrane reviews. Quasi-randomised (where allocation to treatments can be predicted) and non-randomised trials are usually not included, if RCTs were thought feasible for the intervention(s) reviewed. In addition, all Cochrane reviews assess each included primary study for the risk of bias across six dimensions empirically shown to influence outcomes. They are: generation of the randomisation sequence; concealment of allocation; blinding (often assessed separately for subjectively reported outcomes, where lack of blinding could introduce bias; and for objectively ascertained outcomes, where lack of blinding usually does not introduce bias); incomplete outcome reporting (again often assessed separately for efficacy measures; and for harms that are less often reported adequately); selective reporting; and other biases such as conflicts of interest. Many non-Cochrane reviews either do not routinely evaluate the risk of bias, or use unreliable quality scales to assess study quality (6). These methods used in Cochrane systematic reviews also facilitate the detection of scientific misconduct, misinformation, and redundant publications (21).
- Pooling the results of trials instead of “counting votes”: A meta-analysis averages the results of individual trials that provided data for the proportions of participants randomised to the intervention versus the comparison that experience a particular outcome. This is done in order to provide a pooled common estimate of relative effects. The results of the individual trials are commonly expressed as risk ratios (RR) or odds ratios, along with their 95% confidence intervals (CI) (22). For the pooled effect estimate in a meta-analysis, each trial is proportionately weighted so that larger trials, and trials where more people experienced the outcome of interest, particularly with the control intervention or comparison arm (indicating a high baseline risk of developing the outcome), are given more weight in the pooled estimate. The proportionate weight assigned to each trial is the inverse of its variance (a measure that combines the two parameters described above and indicates more precise estimates of the likely range of results). Thus trials that provide more information with more precise results get more weight in the pooled results of all the trials. This is instinctively more appealing than counting the number of trials where the result favoured the intervention over the comparison, versus the number of trials where the reverse occurred, or where the results were inconclusive. In this traditionally used “vote-counting” method, the results of a large trial and a small trial would each be counted as one for and one against the intervention being effective.
- Ensuring the results are statistically significant and clinically important: In conventional terms, these results are statistically significant as the p value is < 0.05 (The last row in the forest plot tests the overall effects and reveals the actual p value to be 0.04; indicating that one can be 96% certain that the difference in the effects of the two drugs is not due to chance). From a clinical perspective, an RR of 0.70 means that drug A reduces the risk of death by 30%, and while we think this is the actual estimate of relative risk reduction (RRR), the upper and lower limits of the CI of the estimate suggests that the risk of death could be reduced by as much as 50%, or as little as 1%. If the higher estimate were true, this would be even better than what we think the estimate is, but if it were the lower estimate, then the clinical usefulness of drug A over drug B in averting 1% fewer deaths is less encouraging, given that 51 (6%) of people given drug A in the five trials died versus 72 (8%) with drug B; unacceptably high rates of death with both drugs. If one evaluated the actual number of deaths averted with drug A (51/930) compared to drug B (72/928), the Absolute Risk Difference (ARR) is 0.0227; 95% CI 0.0001-0.0457. This indicates that drug A averted just two deaths out of 1000 people treated compared to 1000 people given drug B; and this could be as few as 1/1000 treated or as many as 5/1000 treated, again not very impressive achievements.
- Detecting, quantifying, and explaining inconsistency in the results across studies: An oft-repeated criticism of meta-analysis is that combining the results of dissimilar trials is akin to mixing apples and oranges and is likely to yield no meaningful results (unless one is interested in fruit-salad!). If the effects are virtually identical in all trials in the meta-analysis, then confidence in the pooled weighted summary estimate as representing the average effect of the intervention versus the control is strengthened. If there is inconsistency in the direction, magnitude and precision of the effect estimates in meta-analyses, suggesting the intervention worked better in some trials than in others, confidence that the pooled estimate accurately describes the average effect of the intervention is diminished.
- Explaining heterogeneity: It is assumed that combining the results of different studies is likely to result in heterogeneity, should the trials differ significantly in clinical characteristics and methods. Review authors, therefore attempt to ensure that the trials in a meta-analysis are sufficiently similar in their methods, participants, interventions and outcomes to meaningfully combine. Cochrane review protocols also pre-specify ways in which the reasons for heterogeneity would be explored, should the above tests indicate the presence of substantial inconsistency in results not accounted for by chance [I2 > 50%]. One method of exploring inconsistency is to pre-specify a limited number of subgroups, based on features of the participants, interventions, comparisons, outcomes, or the methods used that could explain why drug A might work better than drug B in some trials and not in others that did not share these features.
Hence, apart from searching different online databases, Cochrane reviews routinely search the Cochrane Central Register of Controlled Clinical Trials (CENTRAL), the world’s largest repository of information regarding clinical trials that forms part of The Cochrane Library. It includes details of published articles taken from multiple bibliographic databases, other published resources, and from unpublished sources. Cochrane reviews also routinely search the specialised registers of the respective collaborative review groups supporting the review. Experts in the field and drug manufacturers are contacted for further, often unpublished, information, as well as the authors of identified studies; and the cross references of these studies are searched for further references. Clinical trials registries are also searched for on-going trials. No language restrictions are applied in the search strategy in order to avoid language bias; regional databases are also searched, and retrieved reports are translated, if needed.
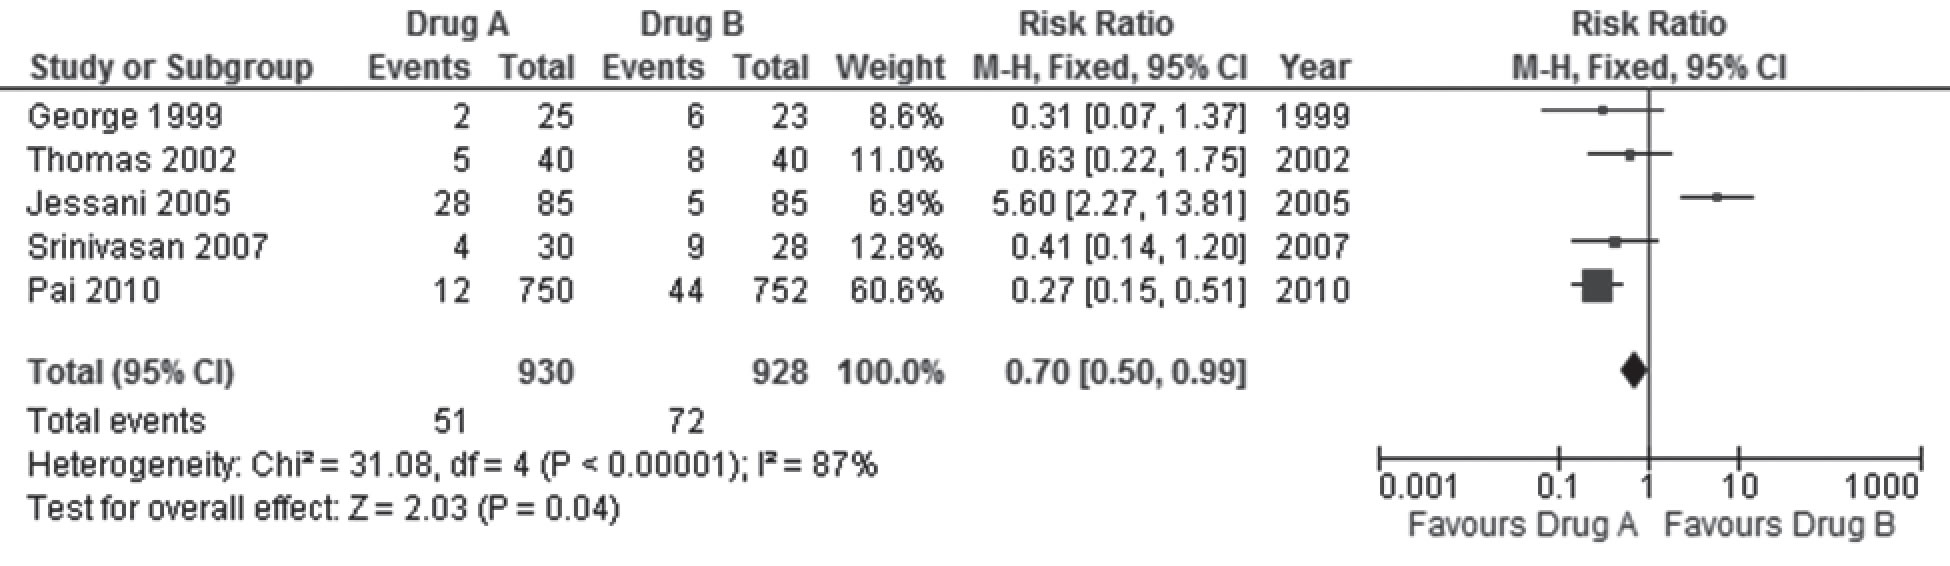
An example is provided in Figure 1 that displays a (fictitious) meta-analysis (or forest plot) comparing drug A with drug B for the treatment of obesity. The outcome assessed in the figure is the risk of death.
In this hypothetical example, the five trials (identified in the rows in column 1 by the last name of the first author and year of publication) included in the meta-analysis randomised 930 adults to anti-obesity drug A, of whom 51 died, (columns two and three), and 928 adults to anti-obesity drug B, of whom 72 died (columns three and four). The variance in the trial by Pai 2010 was the least since it provided the most information (largest sample size and most deaths) and had the most precise results (narrow confidence intervals), and hence is assigned the most weight (66.6%) (column four) in the meta-analysis. Jessani 2005 had the next largest sample size and next highest number of deaths, but gets the least weight (6.9%) since it had the least deaths in the control group (drug B), and the least precise results. The rows in the sixth column display the numerical values of the relative (RR) and 95% CI for the comparisons from each trial (without differential weighting). This is also graphically displayed in the last column as a forest of horizontal lines (hence the name “forest plot”; if there were many more trials, the resemblance to a forest of lines would be even more apparent) scattered around the vertical line that touches the base of the plot at the RR of 1(no significant difference). The rectangular blob in the middle of the horizontal lines represents the RR estimate for each trial. The size of the blob is proportionate to the weight assigned to each trial. The width of the horizontal lines depicts the upper and lower limits of the 95% confidence intervals.
The pooled results of the five trials (proportionately weighted in the formula used for the meta-analysis to yield the weighted average) are provided in the last row. The pooled RR is 0.70 [95% CI 0.50 -0.99], and represents the average risk of death with drug A compared to drug B. The diamond at the bottom of the graph in the last column includes the pooled RR and confidence limits of the five trials. The lower limit of the pooled 95% CI in the diamond [RR = 0.99] stops short of touching the vertical line [RR = 1].
This example highlights the importance of evaluating effect sizes such as the RR and 95% CI, rather than only rely on p values < 0.05 to denote that the differences in the results are significant. The p value will continue to be < 0.05, even if the RR was 0.30, 95% CI 0.20 – 0.40; a result that is both statistically significant (both limits of the CI < 1), and clinically important (we estimate that drug A would reduce the risk of death by 70%, though it could be as low as 60% or as much as 80%). This example also emphasises the need to examine the absolute effects to understand the true benefits and harms of interventions, in addition to the more impressive relative estimates of effects.
This example highlights the importance of evaluating effect sizes such as the RR and 95% CI, rather than only rely on p values < 0.05 to denote that the differences in the results are significant. The p value will continue to be < 0.05, even if the RR was 0.30, 95% CI 0.20 – 0.40; a result that is both statistically significant (both limits of the CI < 1), and clinically important (we estimate that drug A would reduce the risk of death by 70%, though it could be as low as 60% or as much as 80%). This example also emphasises the need to examine the absolute effects to understand the true benefits and harms of interventions, in addition to the more impressive relative estimates of effects.
Clinical heterogeneity; Clinical heterogeneity arises from differences in the clinical aspects of trials. Trials carried out in different countries; in different years or even decades; on different populations; with different definitions and thresholds for diagnosis; and varying grades of severity of the health condition; are likely to yield results that differ considerably. Similarly trials using interventions that differ in doses, formulations, combinations, routes, regimens, and durations of treatment; and comparing them with placebo or no treatment, and a myriad of alternative treatments with the same dizzying array of variations, will also yield differing results. Trials that use outcomes that are defined, and ascertained in different ways, and at different time-points will add to the possibility of yielding results that are inconsistent in a meta-analysis.
Trials in meta-analyses whose methods increase the risk of bias often differ in their results from those at low risk of bias, resulting in methodological heterogeneity. Finally the results may be inconsistent purely by chance. Clinical and methodological reasons for heterogeneity can result in statistical heterogeneity that is not uncommon. What is important is to identify if observed inconsistency in the results is due to chance (random error), and to what extent important differences in the trials contribute to the inconsistency. This will help determine if the results of the individual trials can be still be pooled and presented as an average, or fixed effect, of the intervention across all the trials (hence the use of the term fixed effect meta-analysis in the figure legend and at the top of the last column).
However, if one inspects the graphical display of results in Figure 1, it is easily apparent that in Jessani 2005, the RR of 5.60; 95% CI 2.27 – 13.81 indicates that drug B was far more effective than drug A; a result that is in the opposite direction to the RR estimates of the other four trials. In the graphical display and the numerical description, the confidence limits in Jessani 2005 also clearly do not overlap with those of the other trials. Non-overlapping confidence intervals, especially if accompanied by effect estimates that differ in the direction of effects, are clear indications that the results from all the trials included in the meta-analysis are inconsistent with the pooled result, raising the possibility of statistical heterogeneity. It is possible (though unlikely given the clear difference in the direction of effects) that this inconsistency in results is due to chance. The chi-square (x2) test for homogeneity shown in the second last row reveals a very small p value, indicating that one can be 99.99999% sure that this inconsistency is not due to chance but due to differences in the trials (clinical or methodological heterogeneity).
Just as with the previous example, the p value from the chi-square test only provides us the certainty of excluding chance as an explanation of a result, and does not reveal how much of this inconsistency is actually important. The final notation in the second last row of the figure reveals an I2 value of 87%. The I2 statistic is derived from the chi-square test and reinterprets this to indicate the proportion of inconsistency that is due to true heterogeneity in the trials. The I2 value of 87% indicates that only 13% of the inconsistency observed is due to chance and 87% is due to differences in the way the drug works in the trials. This degree of inconsistency is too large to ignore; and it would be unreasonable to assume that the pooled effect estimates provide a realistic average effect of drug A. Had this value been less than 25%, one might be less worried about heterogeneity in the meta-analysis since more than 75% of the differences in results of the five trials occurred by chance.
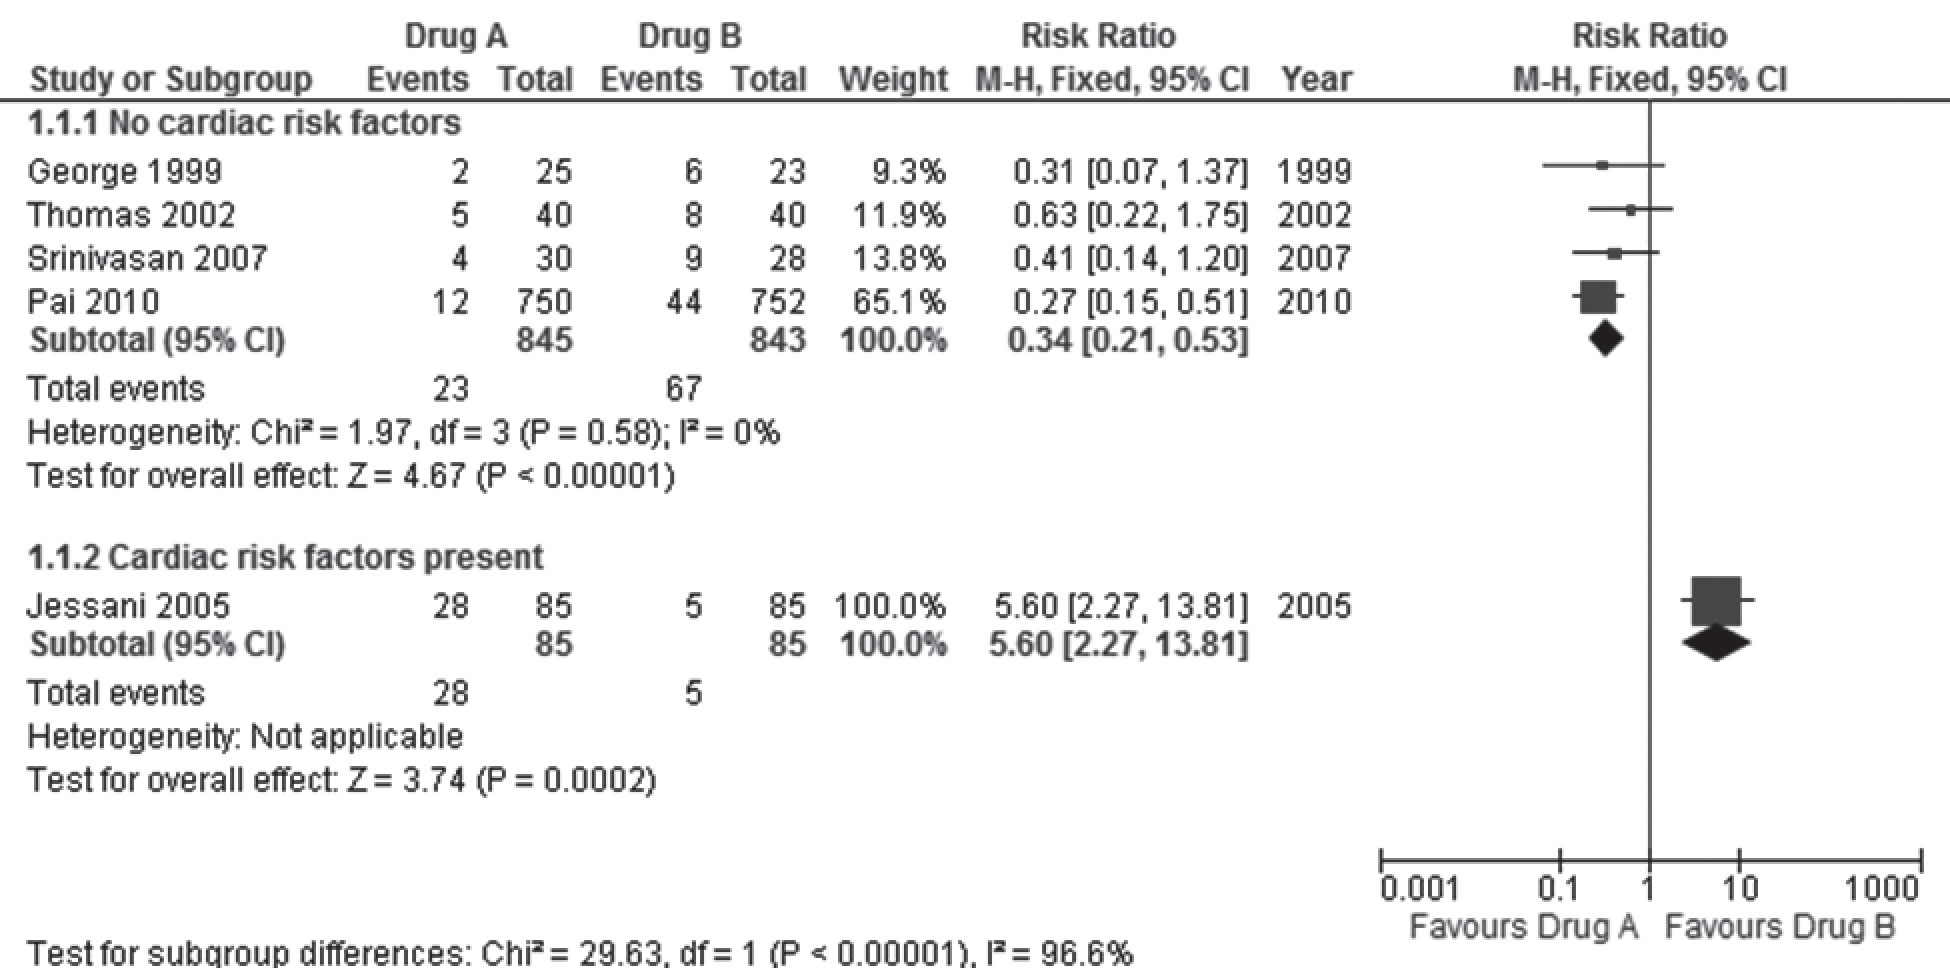
For example, let us assume that the review authors had pre-specified that if substantial heterogeneity was detected, the trials would be sub-grouped by the presence of pre-existing risk factors for cardiac disease in participants. If Jessani 2005 had included many participants with previous episodes of angina or cardiac disease who were on medications, while the other trials had excluded such participants, the sub-group analysis of the forest plot would look different (Figure 2).
The meta-analysis now shows that the pooled results in the subgroup of trials where participants had no cardiac risk factors, drug A was far more effective than drug B in reducing the risk of death. There is no inconsistency in the results within this subgroup of trials [I2 = 0%]. Death was more likely with drug A than drug B for those with previous angina on medications, and this could be due to the heart condition and / or to medication interactions. It would be meaningless to pool the results of the five trials now in the face of such substantial heterogeneity, and significant differences in effect estimates in the sub-groups. However, the inconsistency in the pooled results of the five trials helped us in understanding the differential effects of drugs A and B in those with cardiac risk factors that would not have been so apparent from the results of a single trial.
Conclusions
These and other methods described in detail in the Cochrane Handbook, ensure that the results of Cochrane systematic reviews are robust and reliable. However, the numerical results alone may be insufficient to inspire confidence in the effects of the intervention, or to require a change in practice. Systematic reviews differ in the numbers of included trials that met inclusion criteria, or that provided data for each outcome in the reviews. They also differ in the risk of bias in the included studies; and even in those that contributed data for different outcomes within a review. Two systematic reviews addressing the same question may yield different conclusions and differ in the way they selected outcomes and defined outcome thresholds. A systematic review may conclude that drug A is recommended; and another systematic review may subsequently conclude that the drug is harmful, due to hitherto undisclosed adverse effects. The review may find that drug A causes fewer deaths than drug B but is less effective in treating obesity. Future comments in this journal will describe methods of integrating the numerical results with other important information when summarising the results of meta-analyses in systematic reviews, so that one can understand how much confidence to place in the overall evidence provided to reliably inform health decisions.
Forces propelling change
Competing interests The author is a contributor to the Cochrane Collaboration (www.cochrane.org) and director of one of the 14 independent Cochrane Centres (www.cochrane-sacn.org) worldwide. He has received research funding, travel support, and hospitality from organisations that support evidence-based healthcare.
Funding support The author is a salaried employee of the Christian Medical College, Vellore.
Declaration This article has not been previously published or submitted for publication elsewhere
References
- Tharyan P. Evidence-based medicine: can the evidence be trusted? Indian J Med Ethics. 2011;8(4):201-7.
- Wu T, Li Y, Bian Z, Liu G, Moher D. Randomised trials published in some Chinese journals: how many are randomised? Trials. 2009;10:46.
- Zhang D, Freemantle N, Cheng KK. Are randomised trials conducted in China or India biased? A comparative empirical analysis. J Clin Epidemiol. 2011 Jan;64(1):90-5.
- Tharyan P, Premkumar TS, Mathew V, Barnabas JP, Manuelraj. Editorial policy and the reporting of randomised controlled trials: a survey of instructions for authors and assessment of trial reports in Indian medical journals (2004-05). Natl Med J India. 2008 Mar-Apr;21(2):62-8.
- Tharyan P. Evidence of the people, by the people, and for the people. Cochrane Database Syst Rev. 2010;8:ED000013.
- Moher D, Tetzlaff J, Tricco AC, Sampson M, Altman DG. Epidemiology and reporting characteristics of systematic reviews. PLoS Med. 2007 Mar 27;4(3):e78.
- Tricco AC, Tetzlaff J, Pham B, Brehaut J, Moher D. Non-Cochrane vs. Cochrane reviews were twice as likely to have positive conclusion statements: cross-sectional study. J Clin Epidemiol. 2009 Apr;62(4):380-6 e1.
- Hahn S, Kim S, Garner P. Reduced osmolarity oral rehydration solution for treating dehydration caused by acute diarrhoea in children. Cochrane Database Syst Rev.2002(1):CD002847.
- Duley L, Henderson-Smart D. Magnesium sulphate versus phenytoin for eclampsia. Cochrane Database Syst Rev. 2003(4):CD000128.
- Duley L, Henderson-Smart D. Magnesium sulphate versus diazepam for eclampsia. Cochrane Database Syst Rev. 2003(4):CD000127.
- Enayati AA, Hemingway J, Garner P. Electronic mosquito repellents for preventing mosquito bites and malaria infection. Cochrane Database Syst Rev. 2007(2):CD005434.
- Volmink J, Garner P. Directly observed therapy for treating tuberculosis. Cochrane Database Syst Rev. 2007(4):CD003343.
- Galappaththy GN, Omari AA, Tharyan P. Primaquine for preventing relapses in people with Plasmodium vivax malaria. Cochrane Database Syst Rev. 2007(1):CD004389.
- Farquhar C, Marjoribanks J, Lethaby A, Suckling JA, Lamberts Q. Long term hormone therapy for perimenopausal and postmenopausal women. Cochrane Database Syst Rev.2009(2):CD004143.
- Alderson P, Roberts I. Corticosteroids for acute traumatic brain injury. Cochrane Database Syst Rev.2005(1):CD000196.
- Alderson P, Bunn F, Lefebvre C, Li WP, Li L, Roberts I, et al. Human albumin solution for resuscitation and volume expansion in critically ill patients. Cochrane Database Syst Rev. 2004(4):CD001208.
- Hopewell S, Loudon K, Clarke MJ, Oxman AD, Dickersin K. Publication bias in clinical trials due to statistical significance or direction of trial results. Cochrane Database Syst Rev. 2009(1):MR000006.
- Dwan K, Altman DG, Arnaiz JA, Bloom J, Chan AW, Cronin E, et al. Systematic review of the empirical evidence of study publication bias and outcome reporting bias. PLoS One.2008;3(8):e3081.
- Nassir Ghaemi S, Shirzadi AA, Filkowski M. Publication bias and the pharmaceutical industry: the case of lamotrigine in bipolar disorder. Medscape J Med. 2008;10(9):211.
- Schulz KF, Chalmers I, Hayes RJ, Altman DG. Empirical evidence of bias. Dimensions of methodological quality associated with estimates of treatment effects in controlled trials. JAMA. 1995 Feb 1;273(5):408-12.
- Vlassov V, Groves T. The role of Cochrane Review authors in exposing research and publication misconduct. Cochrane Database Syst Rev. 2010;8:ED000015.
- Selvan MS, Subbian S, Cantor SB, Rodriguez A, Smith ML, Walsh GL. Ethics of transparency in research reports. Indian J Med Ethics. 2011;8(1):31-6.